
Ced's NOC Live Network Operations Center
A custom-built, public facing Network Operations Center dashboard running at noc.chasedumphord.com providing real time visibility into Ced's HomeLab infrastructure, services, and RF edge systems.




What This Is
This is the public-facing front door to Ced's HomeLab infrastructure. This is the frontend layer of Ced's observability platform a custom built status page that makes live infrastructure data publicly accessible without requiring login. The backend engine (ceds-observability-stack) handles metrics collection via Prometheus and Grafana. This repo is what the public sees real-time service status, latency, and health across every layer of the homelab. No login required.
It's not a template or a third party uptime service. It's a purpose built frontend that pulls live status data and presents it as a professional NOC dashboard. Every card on the page represents a real, running service with real latency and uptime data.
Live Dashboard
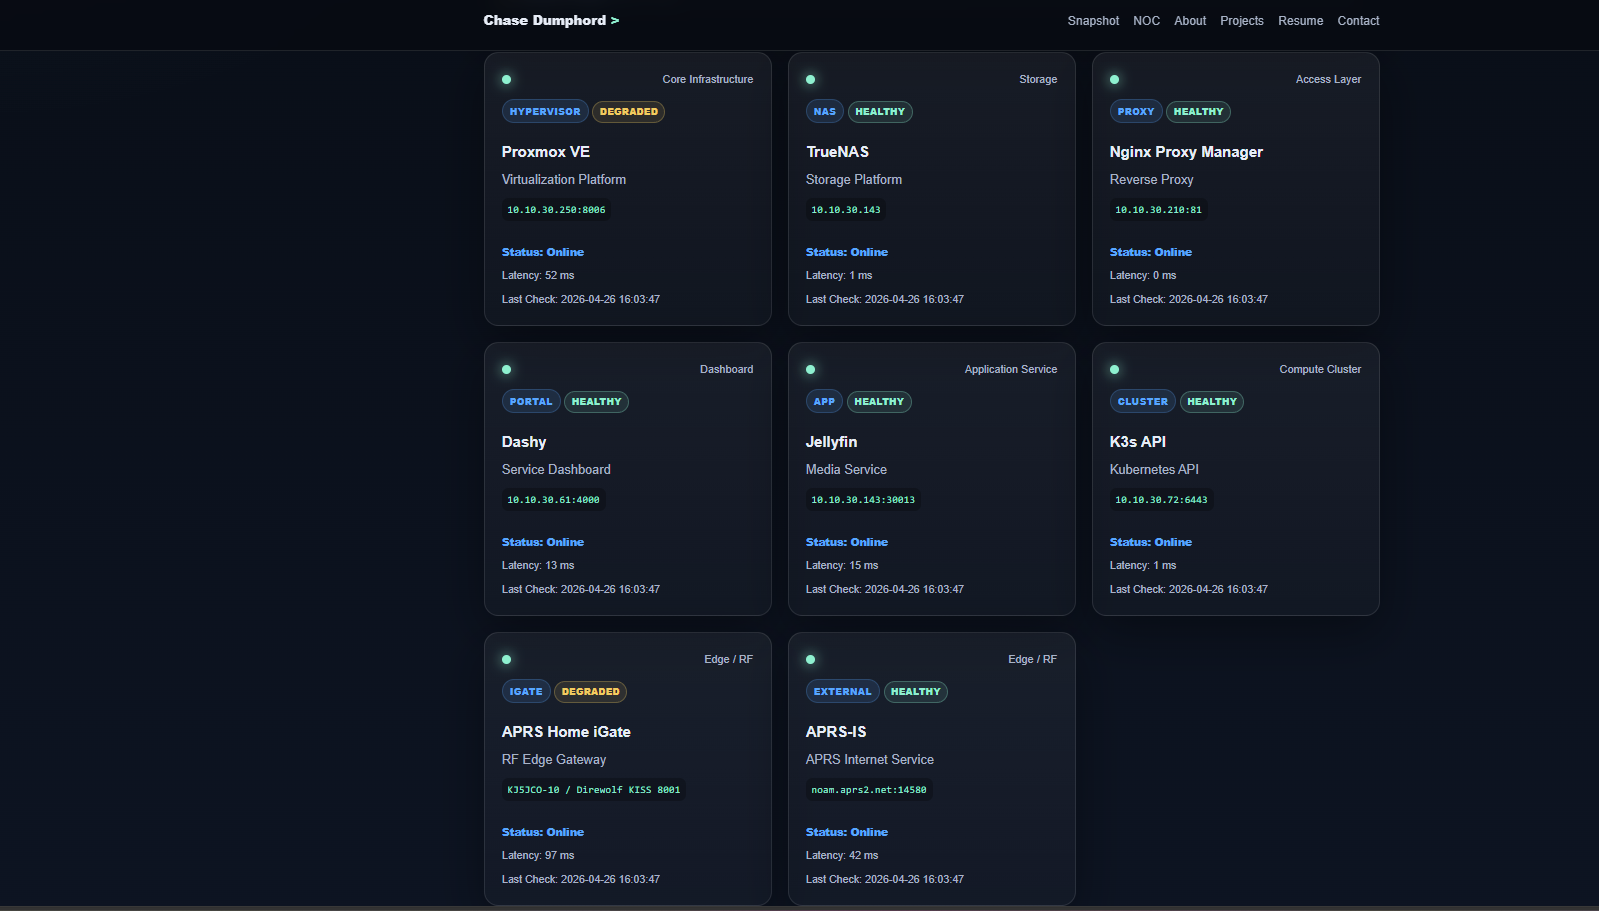
The NOC displays real time status for every layer of the infrastructure stack from the Proxmox hypervisor down to the APRS RF edge system.
System Coverage
Core Infrastructure
| Service | Role | Status Source |
|---|---|---|
| Proxmox VE | Hypervisor — 6-node HA cluster | TCP probe via Blackbox |
| TrueNAS | Storage platform | TCP probe via Blackbox |
| Nginx Proxy Manager | Reverse proxy | TCP probe via Blackbox |
Application Layer
| Service | Role | Status Source |
|---|---|---|
| Dashy | Service dashboard | TCP probe via Blackbox |
| Jellyfin | Media service | TCP probe via Blackbox |
| K3s API | Kubernetes cluster API | TCP probe via Blackbox |
Edge / RF Systems
| Service | Role | Status Source |
|---|---|---|
| APRS Home iGate | RF to internet gateway (KJ5JCO-10) | TCP probe via Blackbox |
| APRS-IS | External APRS internet service | TCP probe noam.aprs2.net:14580 |
Architecture
graph LR
    subgraph Backend["Backend — ceds-observability-stack"]
        PROM[Prometheus]
        BB[Blackbox Exporter]
        SCRIPTS[Python Status Scripts]
    end

    subgraph NOC["Frontend — ceds-noc"]
        PAGE[noc.chasedumphord.com]
        BADGE[noc-badge.json]
        STATUS[noc-status.json]
    end

    subgraph Infrastructure["Live Infrastructure"]
        PVE[Proxmox VE]
        TN[TrueNAS]
        K3S[K3s API]
        APRS[APRS iGate]
        SERVICES[Services]
    end

    Infrastructure --> BB --> PROM
    PROM --> SCRIPTS
    SCRIPTS --> BADGE & STATUS
    BADGE & STATUS --> PAGE
Data flow:
- Blackbox Exporter probes all services via TCP/HTTP
- Prometheus collects and stores probe results
- Python scripts generate status JSON from Prometheus data
- NOC frontend reads JSON and renders live status cards
- Public visitors see real time infrastructure status no login needed
Repository Structure
ceds-noc/
├── assets/
│   └── images/             # NOC page assets
├── data/
│   ├── noc-badge.json      # Live status badge data
│   └── noc-status.json     # Live service status data
├── screenshots/
│   ├── noc-metrics.png     # NOC metrics view
│   └── noc-systems.png     # NOC systems overview
├── scripts/
│   ├── generate-noc-badge.py   # Generates badge JSON from Prometheus
│   └── generate-noc-status.py  # Generates status JSON from Prometheus
├── index.html              # NOC frontend
├── script.js               # Status page logic
└── style.css               # NOC styling
Status Card Design
Each service card on the NOC displays:
- Service name and role what it is and what it does
- Category badge HYPERVISOR, STORAGE, CLUSTER, PORTAL, etc.
- Health badge HEALTHY or DEGRADED based on probe results
- Status Online / Offline
- Latency real response time in milliseconds
- Last check timestamp when the probe last ran
This gives anyone viewing the page the same operational picture that the internal Grafana dashboard provides without requiring access to the internal network.
Screenshots
Systems Overview Live Service Status

Metrics Overview

Related Projects
| Project | Role |
|---|---|
| ceds-observability-stack | Backend Prometheus, Grafana, Alertmanager, all exporters |
| ceds-homelab | Infrastructure Proxmox cluster, TrueNAS, networking |
| ced-k3s-homelab | Orchestration 12 node Raspberry Pi K3s cluster |
| ceds-aprs-igate | Edge Dual node APRS RF-to-internet gateway |
Roadmap
- Live service status cards with real probe data
- APRS RF edge system monitoring
- Public access no login required
- Custom badge and status JSON generation
- Alerting integration visual alerts on NOC page
- Historical uptime percentage per service
- Mobile optimized layout
- Auto-refresh with configurable interval
- Public Grafana dashboard embed
Author
Chase Dumphord (Ced) DevOps and Cloud Infrastructure Engineer · GE Aerospace · Oxford, MS


