 Chase DumphordandGitHub
7685da0f5c
Chase DumphordandGitHub
7685da0f5c
Clarified the purpose of the repository and its relation to the backend observability stack.
6.6 KiB
Ced's NOC — Live Network Operations Center
A custom-built, public-facing Network Operations Center dashboard running at noc.chasedumphord.com — providing real-time visibility into Ced's HomeLab infrastructure, services, and RF edge systems.




What This Is
This is the public-facing front door to Ced's HomeLab infrastructure. This is the frontend layer of Ced's observability platform — a custom-built status page that makes live infrastructure data publicly accessible without requiring login. The backend engine (ceds-observability-stack) handles metrics collection via Prometheus and Grafana. This repo is what the public sees — real-time service status, latency, and health across every layer of the homelab. no login required.
It's not a template or a third-party uptime service. It's a purpose-built frontend that pulls live status data and presents it as a professional NOC dashboard. Every card on the page represents a real, running service with real latency and uptime data.
Live Dashboard
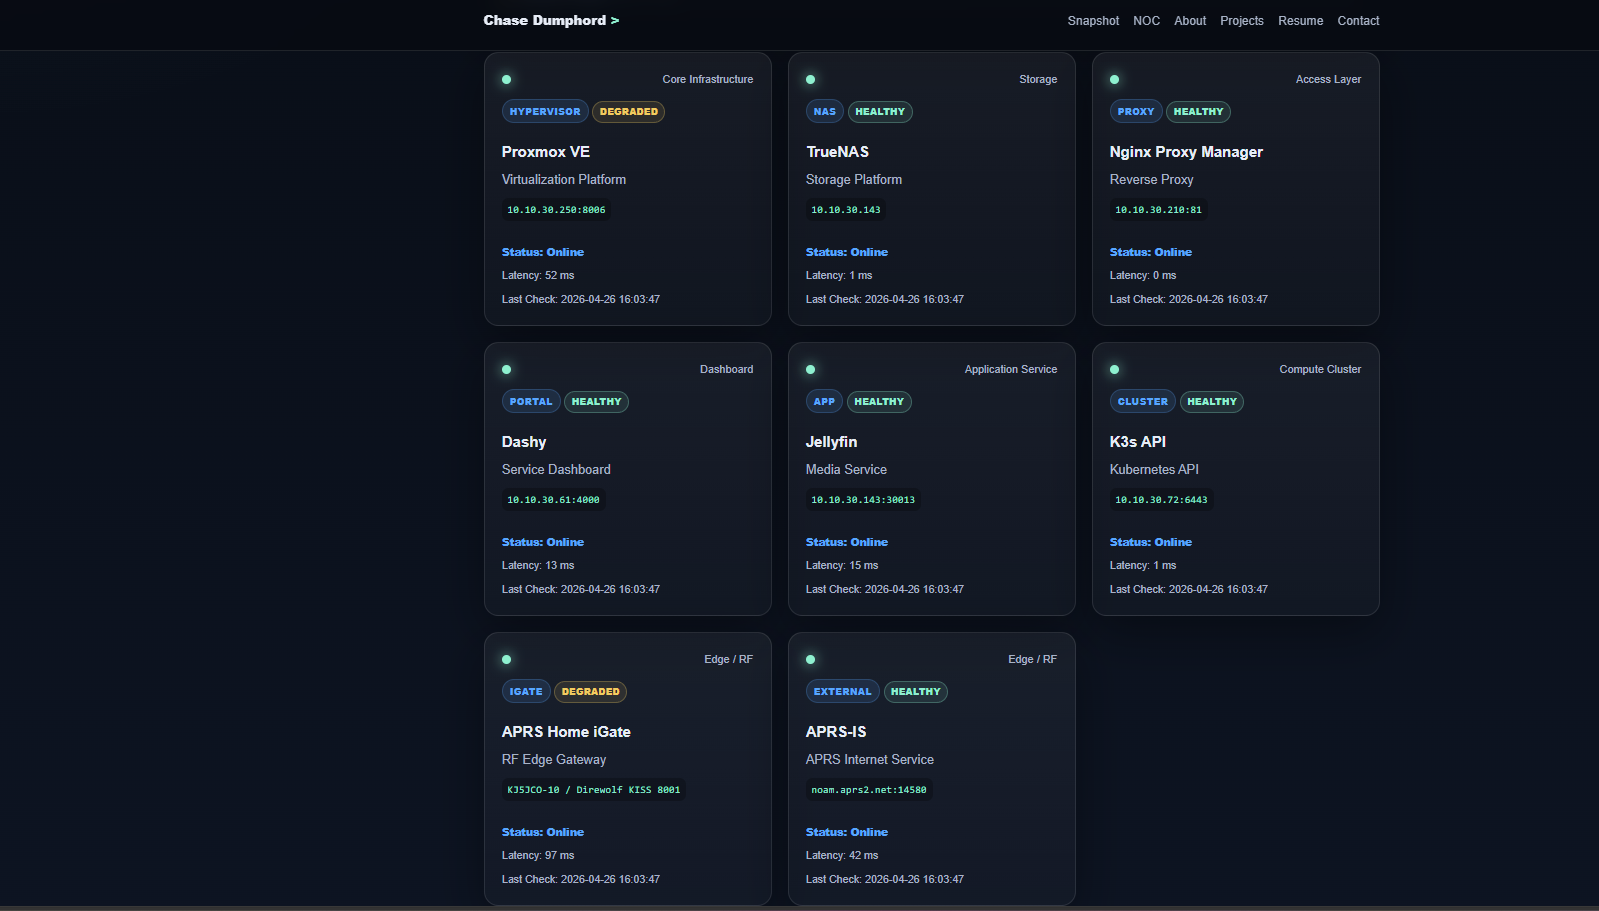
The NOC displays real-time status for every layer of the infrastructure stack — from the Proxmox hypervisor down to the APRS RF edge system.
System Coverage
Core Infrastructure
| Service | Role | Status Source |
|---|---|---|
| Proxmox VE | Hypervisor — 6-node HA cluster | TCP probe via Blackbox |
| TrueNAS | Storage platform | TCP probe via Blackbox |
| Nginx Proxy Manager | Reverse proxy | TCP probe via Blackbox |
Application Layer
| Service | Role | Status Source |
|---|---|---|
| Dashy | Service dashboard | TCP probe via Blackbox |
| Jellyfin | Media service | TCP probe via Blackbox |
| K3s API | Kubernetes cluster API | TCP probe via Blackbox |
Edge / RF Systems
| Service | Role | Status Source |
|---|---|---|
| APRS Home iGate | RF-to-internet gateway (KJ5JCO-10) | TCP probe via Blackbox |
| APRS-IS | External APRS internet service | TCP probe — noam.aprs2.net:14580 |
Architecture
graph LR
    subgraph Backend["Backend — ceds-observability-stack"]
        PROM[Prometheus]
        BB[Blackbox Exporter]
        SCRIPTS[Python Status Scripts]
    end

    subgraph NOC["Frontend — ceds-noc"]
        PAGE[noc.chasedumphord.com]
        BADGE[noc-badge.json]
        STATUS[noc-status.json]
    end

    subgraph Infrastructure["Live Infrastructure"]
        PVE[Proxmox VE]
        TN[TrueNAS]
        K3S[K3s API]
        APRS[APRS iGate]
        SERVICES[Services]
    end

    Infrastructure --> BB --> PROM
    PROM --> SCRIPTS
    SCRIPTS --> BADGE & STATUS
    BADGE & STATUS --> PAGE
Data flow:
- Blackbox Exporter probes all services via TCP/HTTP
- Prometheus collects and stores probe results
- Python scripts generate status JSON from Prometheus data
- NOC frontend reads JSON and renders live status cards
- Public visitors see real-time infrastructure status — no login needed
Repository Structure
ceds-noc/
├── assets/
│   └── images/             # NOC page assets
├── data/
│   ├── noc-badge.json      # Live status badge data
│   └── noc-status.json     # Live service status data
├── screenshots/
│   ├── noc-metrics.png     # NOC metrics view
│   └── noc-systems.png     # NOC systems overview
├── scripts/
│   ├── generate-noc-badge.py   # Generates badge JSON from Prometheus
│   └── generate-noc-status.py  # Generates status JSON from Prometheus
├── index.html              # NOC frontend
├── script.js               # Status page logic
└── style.css               # NOC styling
Status Card Design
Each service card on the NOC displays:
- Service name and role — what it is and what it does
- Category badge — HYPERVISOR, STORAGE, CLUSTER, PORTAL, etc.
- Health badge — HEALTHY or DEGRADED based on probe results
- Internal IP and port — where the service lives on the HomeLab VLAN
- Status — Online / Offline
- Latency — real response time in milliseconds
- Last check timestamp — when the probe last ran
This gives anyone viewing the page the same operational picture that the internal Grafana dashboard provides — without requiring access to the internal network.
Screenshots
Systems Overview — Live Service Status

Metrics Overview

Related Projects
| Project | Role |
|---|---|
| ceds-observability-stack | Backend — Prometheus, Grafana, Alertmanager, all exporters |
| ceds-homelab | Infrastructure — Proxmox cluster, TrueNAS, networking |
| ced-k3s-homelab | Orchestration — 12-node Raspberry Pi K3s cluster |
| ceds-aprs-igate | Edge — Dual-node APRS RF-to-internet gateway |
Roadmap
- Live service status cards with real probe data
- APRS RF edge system monitoring
- Public access — no login required
- Custom badge and status JSON generation
- Alerting integration — visual alerts on NOC page
- Historical uptime percentage per service
- Mobile-optimized layout
- Auto-refresh with configurable interval
- Public Grafana dashboard embed
Author
Chase Dumphord (Ced) Digital Systems Engineer · GE Aerospace · Oxford, MS


